State of Origin: Foursquare checkins
I have only been keeping track of foursquare checkins since late April. I get the data between 9pm the day of and 9am the day after. One of the venues I’ve been getting data for has been ANZ Stadium in Homebush. I was curious as to how the State of Origin would rank compared to two of the home games played by the Bulldogs. The following chart shows that:
It looks like the State of Origin game attracted a different audience than Bulldogs and the Rabbitohs. Also worth noting,
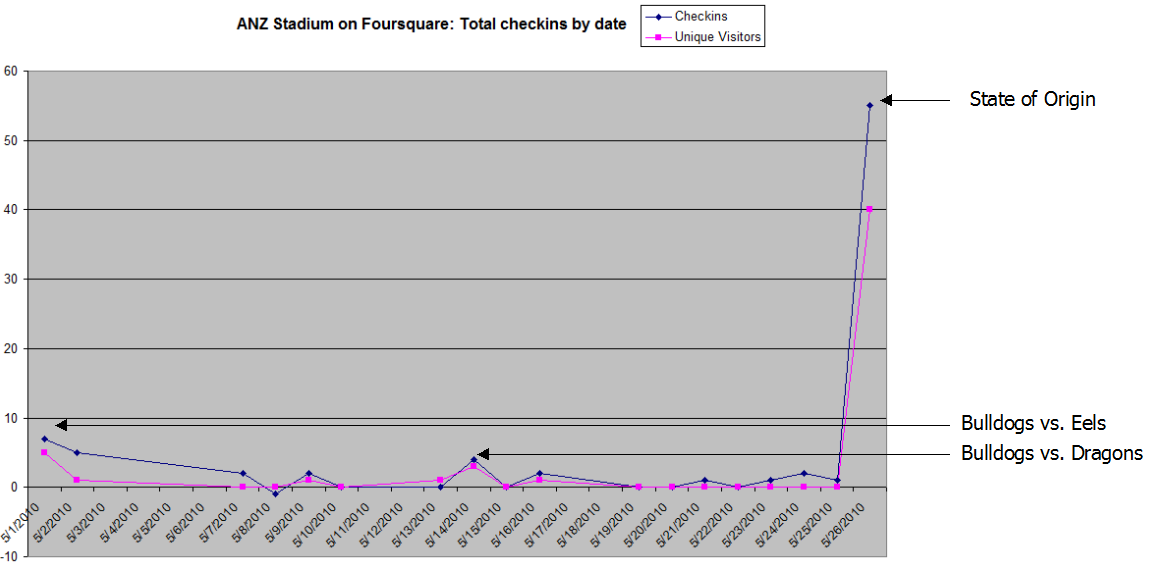
there is a valid negative number in that set. It suggests that people are do delete their checkins. I can’t speculate why as I don’t know who deleted their checkin. I can just tell some one did. That suggests that the reliability of this data is similar to anything on the Internet: People delete and add content. The number you get may not be a total addition but rather the total after deletion and additions.